How to apply APM to .NetCore
Some referred from FeloSearch
Certainly! Setting up Elastic APM with your .NET application involves several steps, which I’ll outline in detail below. We will cover installation, configuration, and deployment, ensuring you’ll be able to monitor your .NET application effectively.
1. Prerequisites
- Elastic Stack: Ensure you have an Elastic Stack (Elasticsearch, Kibana, and APM Server) set up. You can do this locally, but it is often deployed as part of an Elastic Cloud setup.
- .NET SDK: Ensure you have the .NET SDK installed.
- NuGet Package Manager: This is needed for installing necessary dependencies.
2. Setup Apm Test Environment (You might change newest version by your own)
version: '3.9' |
3. Apply on .Net Core
-
Install the Elastic APM NuGet Package:
From the Package Manager Console, run the following command:Install-Package Elastic.Apm.NetCoreAll
-
Configure the APM Agent in your
Startup.cs:
AddUseElasticApmto your application’s middleware pipeline.Example:
public class Startup
{
    private readonly IConfiguration _configuration;

    public Startup(IConfiguration configuration)
    {
        _configuration = configuration;
    }

    public void ConfigureServices(IServiceCollection services)
    {
        services.AddControllersWithViews();
        // additional services configuration
    }

    public void Configure(IApplicationBuilder app, IWebHostEnvironment env)
    {
        app.UseElasticApm(_configuration);
        app.UseStaticFiles();
        app.UseRouting();
        app.UseEndpoints(endpoints =>
        {
            endpoints.MapControllers();
        });
    }
} -
Set up Configuration:
You’ll need to add your Elastic APM configuration settings. This can be done inappsettings.json:{
"ElasticApm": {
"ServerUrls": "http://localhost:8200",
"SecretToken": "YOUR_SECRET_TOKEN",
"ServiceName": "YourApplicationName",
"Environment": "production"
}
} -
Monitor Application Performance via Kibana
-
Access Kibana APM Dashboard:
Open Kibana and navigate to the APM section. This is typically found under “Observability” or can be accessed directly by the APM application. -
View Application Metrics:
You’ll be able to see various performance metrics, including transactions, errors, and traces. These visualizations help identify bottlenecks, performance issues, and the overall health of your application.
-
-
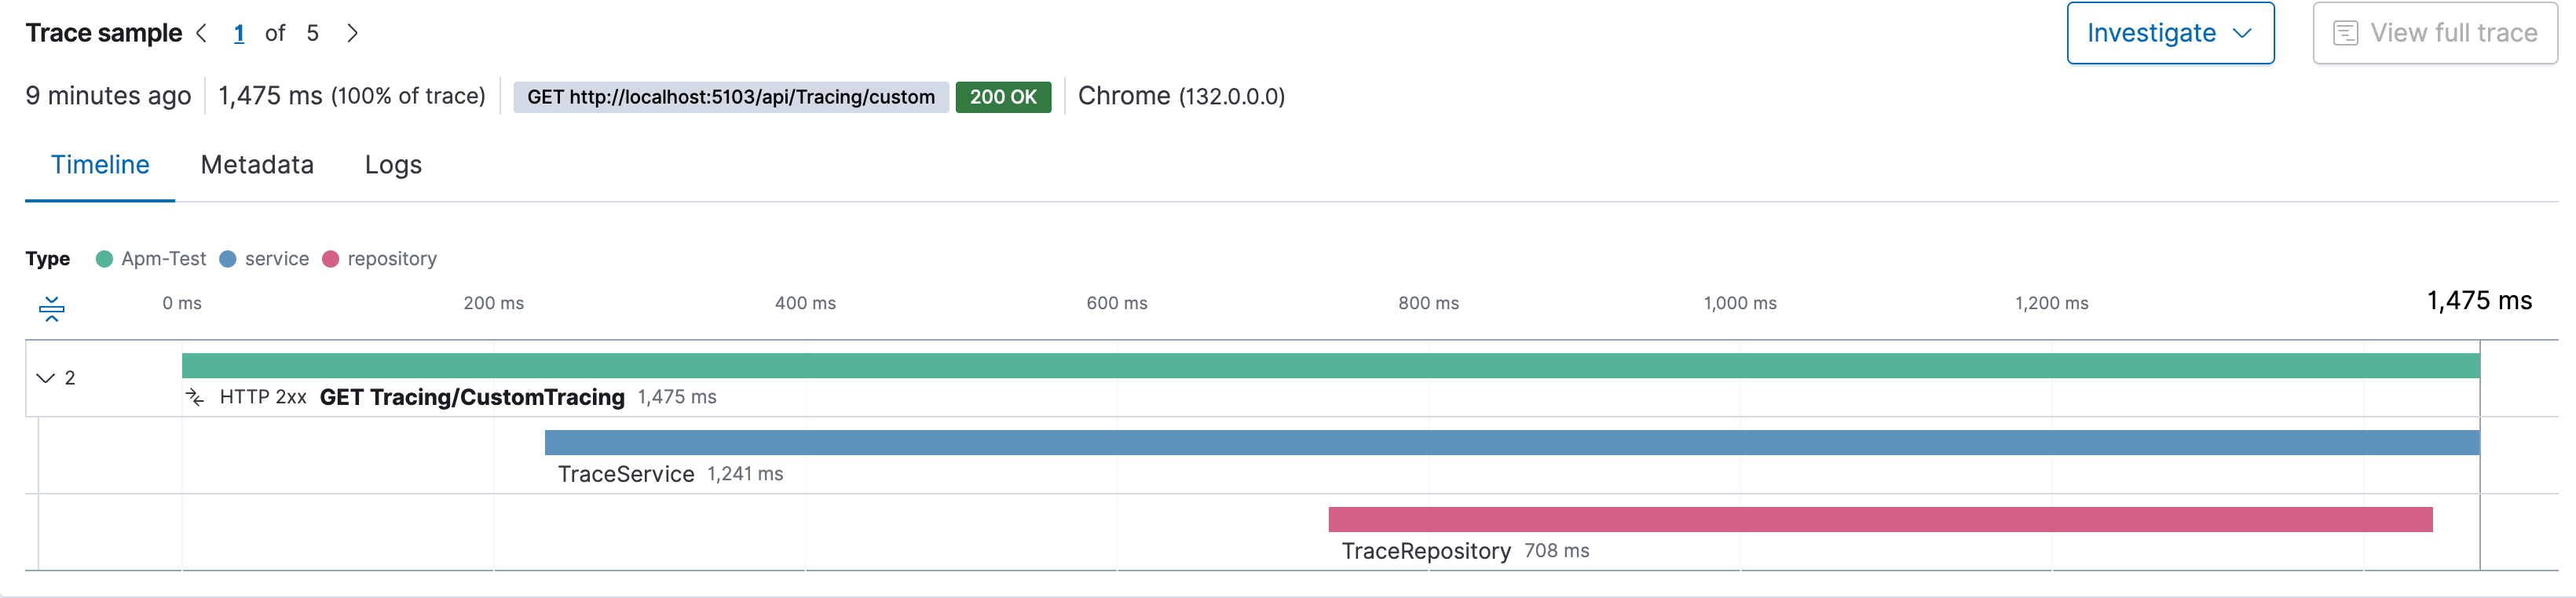
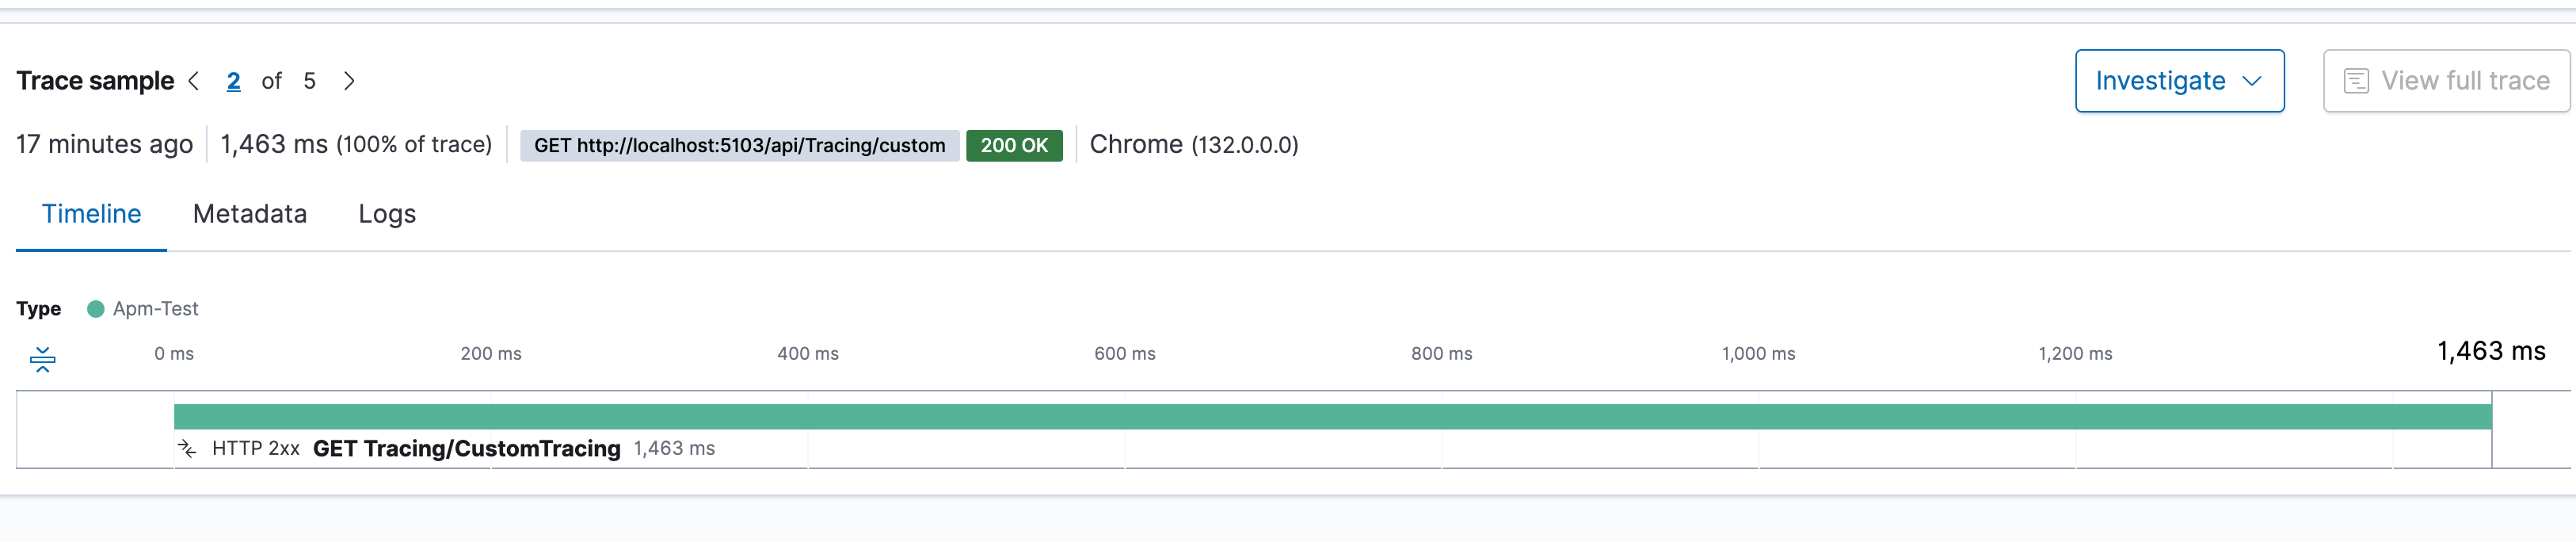
Check tracing in dashboard
4. How to Trace Specific Methods
- Set span in current transaction
|
- Check tracing in dashboard